G-Signal Product User Guide
Professional securities trading is not gambling, nor is it long or short based on technical indicators, nor is it simple buying and selling, but relies on big data that never lies. This is the art of balancing opportunity and risk.
This guide will show you step by step in the form of case study: how to select and use G-Signal products according to your own risk preference, how to customize trading strategies for yourself, and how to prepare for the next good opportunity. When your subscribed signal appears again, you don't have to spend time thinking about it, and you miss the opportunity because of indecision. You will not trade in a hurry, but execute your trading plan step by step. The better the opportunity, the less time you have to think.
Each G-Signal product series corresponds to only one securities, e.g. NQ (NASDAQ 100 index futures). G-Signal products are divided into two factions Bulls and Bears, and are conferred ranks (Bull Signal Rank Conferring Standard & Bear Signal Rank Conferring Standard) according to the signal's historical performance, so that you can have an overall impression of the potential risks and opportunities of using this signal. The higher the signal rank, the better chances of turning the positions, that you established immediately after the signal gets confirmed, to profitable, within a reasonable period of time to endure unrealized losses. The back-tested length of the signal is also an important factor that you should pay attention to. The longer the back-tested length, the more convincing the signal's historical performance statistics. Next, we will take the NQ (NASDAQ 100 index futures) bull signals as examples to show how to select and use the G-Signal products.
The first step is to select the signal product that meet your risk preference by comparing signal products' historical performance. First of all, we compare the probability of 5 price actions after the signal gets confirmed: Soar, Squat-Jump, Push-Up (Bulls) or High-Jump (Bears), Diving, and Plunge (Bull Signal Price Action & Bear Signal Price Action). If you are a trader who does not like taking risks, it is recommended to only pick signals with rank of Generals or higher, because during the back-test period, the price did not do Diving or Plunge after the signal gets confirmed, so the risk control is easier. With this criteria, we got 3 candidates - NQ Bull #1 (Marshal), NQ Bull #2 (Admiral), and NQ Bull #3 (Admiral). Next, we compare the length of the back-test period of these 3 signals, and find that both NQ Bull #1 and NQ Bull #2 are back-tested till June 1999, when NQ started being traded, having a history of 23 years till now. NQ Bull #3 is back-tested till November 2021, much shorter than that of the previous 2 signals. If you are extremely risk averse, forget it. However, the signaling frequency of NQ Bull #3 is much higher than that of two others. It takes an average of 1,977 trading days to wait for NQ Bull #1 to show up once. Calculated on the basis of 250 trading days per year, it will take at least 7 years to wait. The interval between its last two appearances is as long as 13 and a half years. It takes an average of 297 trading days to wait for NQ Bull #2 to show up once, which means an average wait of more than one year. Moreover, although the back-test period of NQ Bull #3 is only one year, the price did not do Diving or Plunge after the signal got confirmed during the whole 2022, which NASDAQ is in big bear market. Its performance is quite impressive. This is indeed a painful choice. But there is no way, the reality is often like this, between safety and opportunity, you can only choose one or the other.
In the second step, you need to develop a risk-controllable trading strategy for the selected signal. As we said above, the clearer we can see the risk boundary, the easier it is for us to formulate a risk-controllable trading strategy. If you selected NQ Bull #1, then the trading strategy is pretty simple. You do nothing but await it to show up again for the next 7 years, 13 years or even more. Its 23-year Historical Risk & Reward Statistics shows that once this signal got confirmed, the price will only do Squat-Jump. The goal of your trading strategy is to handle exceptional situations that the price can do Diving or even Plunge. One of the solutions is to limit the size of the traded funds, say 75% cash positions. All-in trading is never a good idea.
Next, in order to help you understand how to use G-Signal products correctly, we have selected a signal that requires skills to do risk-controllable trading, and do a case study. NQ Bull #5 (First Lieutenant) is the ideal one, because the price has ever tried all 5 actions once this signal gets confirmed, and its performance is back-tested till January 2000, long enough. It's easy to handle Soar and Squat-Jump. It's more challenging to handle Push-Up (prob. 10.47%) which offers at least 2 chances to escape, and Diving (prob. 2.33%) which offers at least one chance to escape. The most challenging is to handle Plunge, even its probability is as low as 1.16%, because it offers no chance to escape. Using such signal to make successful trades requires more sophisticated skills to manage hard-to-control trading risks. Fortunately, G-Signal product offers comprehensive statistical data of each signal to significantly slash the difficulty of controlling trading risks to help traders make successful trades much easier.
Before developing a trading strategy for a signal, we need to study its performance history. The luck of NQ Bull #5 (First Lieutenant) is the worst among the G-Signal NQ Bull series. It lost its first battle. And that is the worst one in its performance history. This signal showed up for the first time in history on the night of April 11, 2000. After that, the NQ price kept going up for few hours. However, the NQ price turned around to do Plunge after this signal got confirmed in the morning of April 12th. In the next 3 trading days, the NQ price fell by 21.7% all the way, and then rebounded strongly to narrow the decline to 5.3%. It was not until more than two months later, on June 19, that NQ price fully recovered all the losses from April 12th. Looking back at this historic failure of NQ Bull #5 in April 2000, we were deeply impressed by the fierce battle between longs and shorts, and how extreme it can go. This extreme is the risk boundary of the signal that we need to see clearly. The signal's risk boundary is the most critical consideration for a trader when formulating a plan to trade with the signal. To succeed in trading securities, the trader needs to develop a risk-controllable trading plan and trade as rationally as possible, without the interference of emotions.
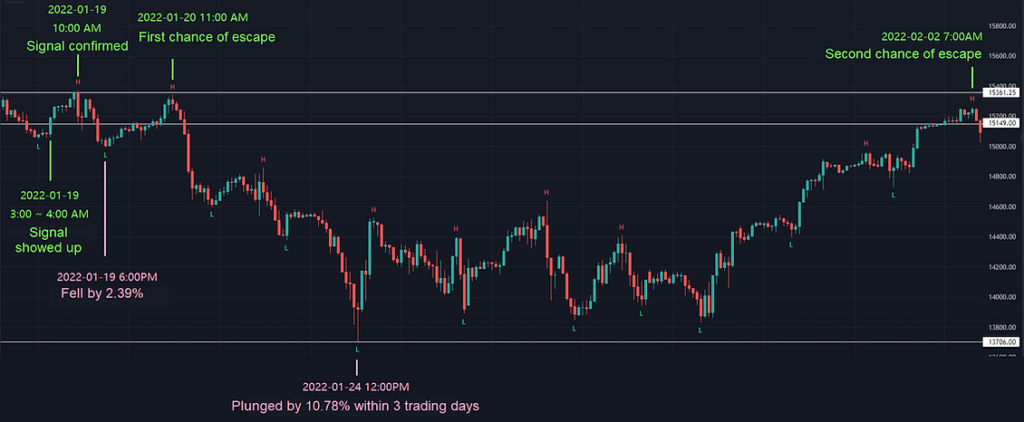
Now, it's time to formulate a trading strategy for this signal. Let's find a real case that it's very difficult to handle, to demonstrate how to do risk management when we formulate the trading strategy according to our risk preference. The third failure in the history of NQ Bull #5 happened on January 19th, 2022. It was also the only time that NQ price did Plunge after this signal got confirmed. Please see the candlestick chart below.
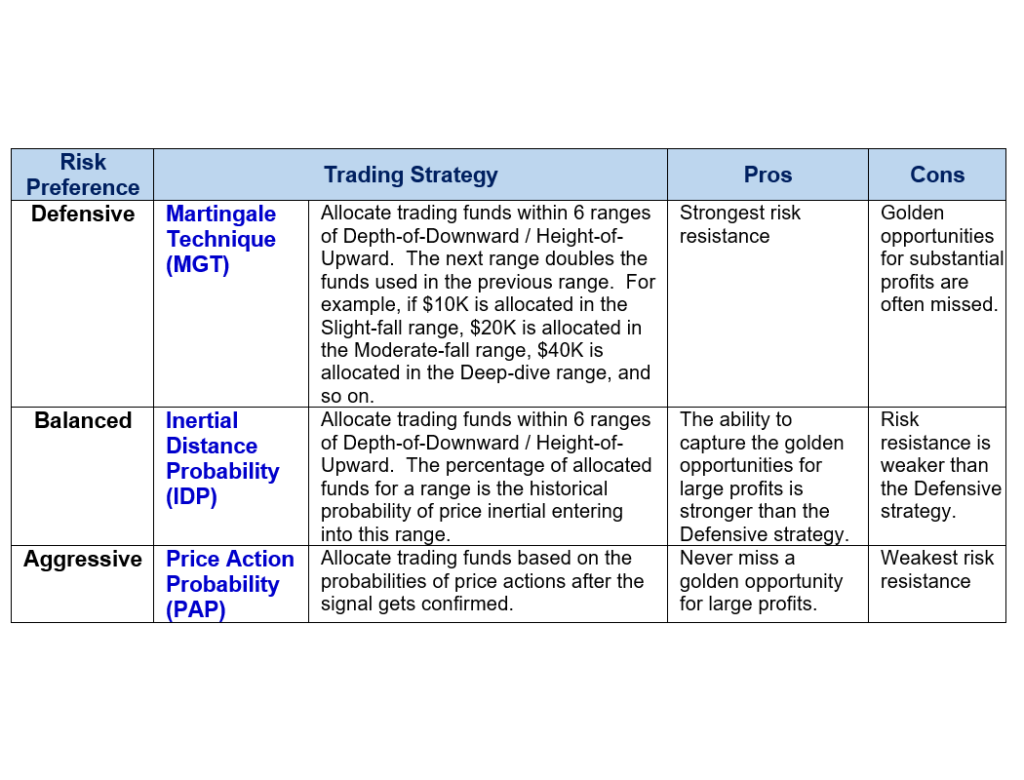
From the perspective of risk control, this case is extreme enough to be ideal to show how to control trading risk by using this G-Signal product. Below, we will apply 3 trading strategies, corresponding to 3 risk preferences - Defensive, Balanced, and Aggressive (see the table below for details), to this case. Of course, you may formulate your own trading strategy that best suits your risk preference. Regardless of your trading strategy, the first rule of thumb is that you should not take all of your available funds on any trade, because there is no perfect system that can predict the future with 100% accuracy. Accidents will happen sooner or later. Risks are everywhere.
Next, we will make 3 trading plans according to the 3 strategies formulated above, and based on the historic performance of NQ Bull #5 as of January 18th, 2022 (see the table below), to prepare for the reappearance of the signal.
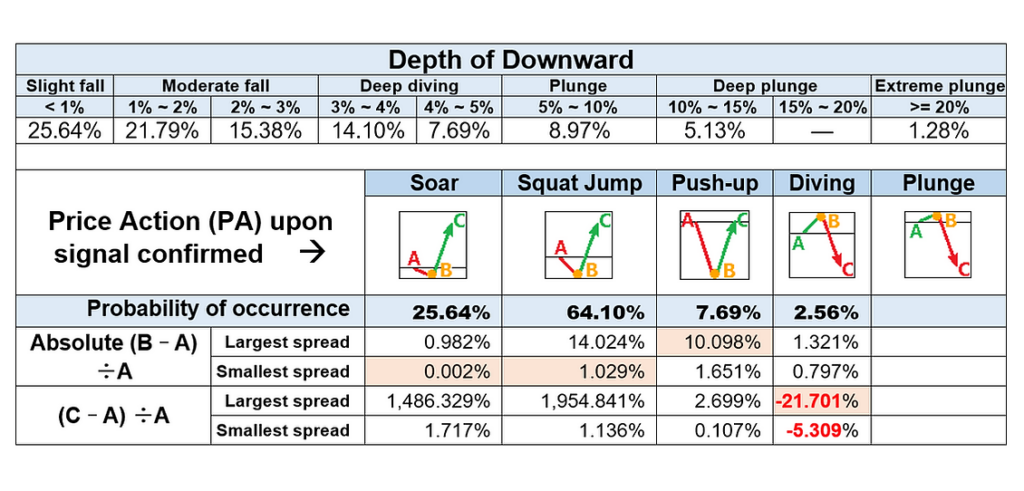
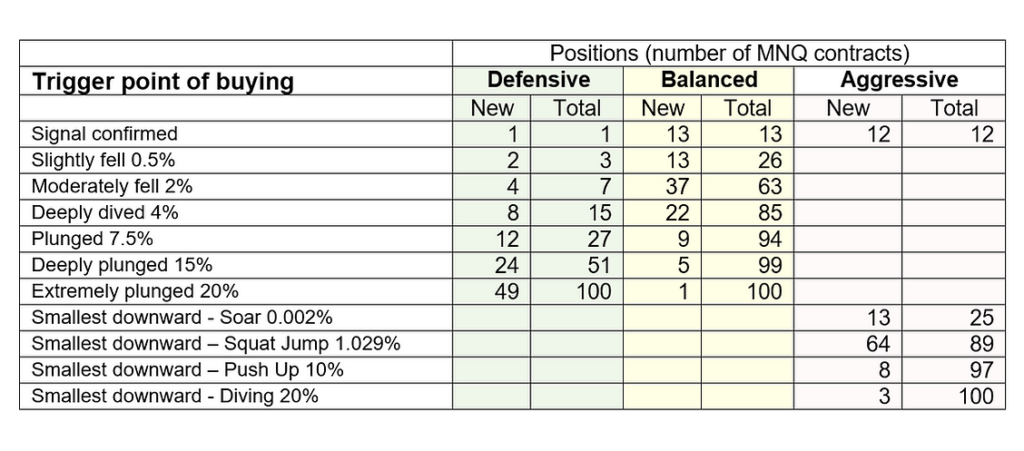
We assume our cash position is US$500k, and we are going to use only 40%, that is $200k, to do the trades. The middle points of the Depth of Downward ranges of NQ Bull #5 are the trigger points to buy in MNQ (NASDAQ 100 index E-micro) contracts. Every point the NQ price moves up or down, each MNQ contract long position generates an unrealized profit or loss of $2. The broker requires the initial margin of each MNQ contract is $2k. Therefore, the maximum number of MNQ contracts we can buy in is 100. Please note, we should NEVER use the margin loan offered by the broker, otherwise trading is gambling. You may use other trading instruments other than futures, such as index ETFs (QQQ, TQQQ, SQQQ, etc.) and/or their options. The 3 trading plans are as follows.
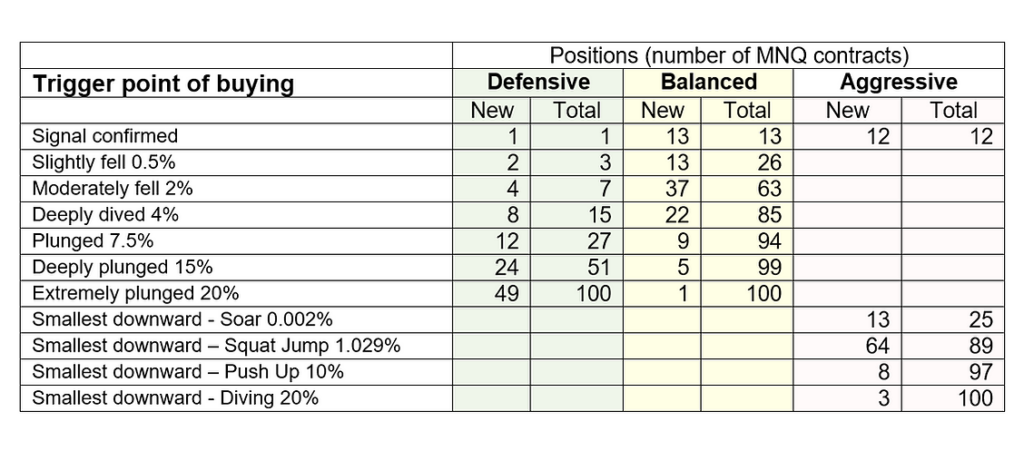
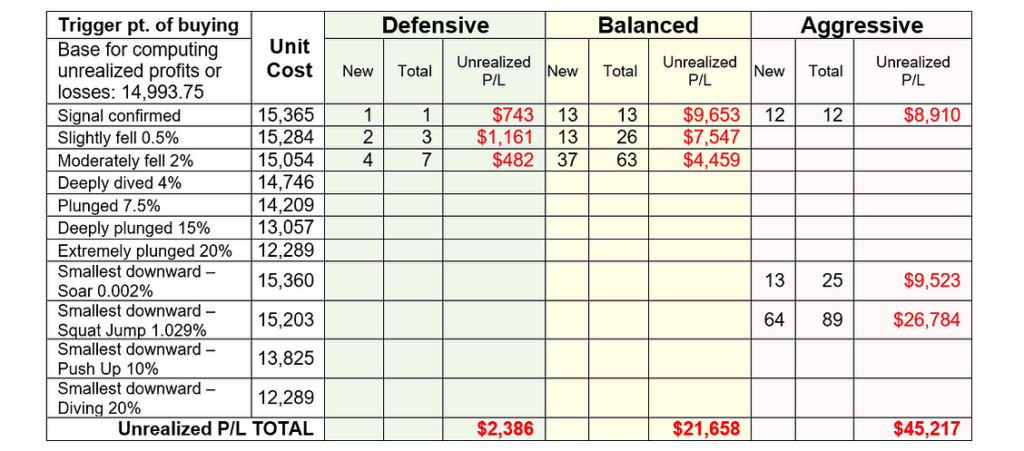
After the trading plan was formulated, we awaited the signal to show up again with patience... At 10:00 on January 19th, 2022, NQ Bull #5 was confirmed at 15,361.25. Our trading plan was triggered. The cost of our first MNQ long position was 15,365.00. As of 18:00 on the same day, the NQ price plunged to the day low 14,993.75. At that moment, the established MNQ long positions of the 3 plans were as follows.
At 11:00 on January 20th, the next day, the NQ price rebounded to day high 15,340.25, where was the first chance to escape. At that moment, the positions of 3 plans are as follows.
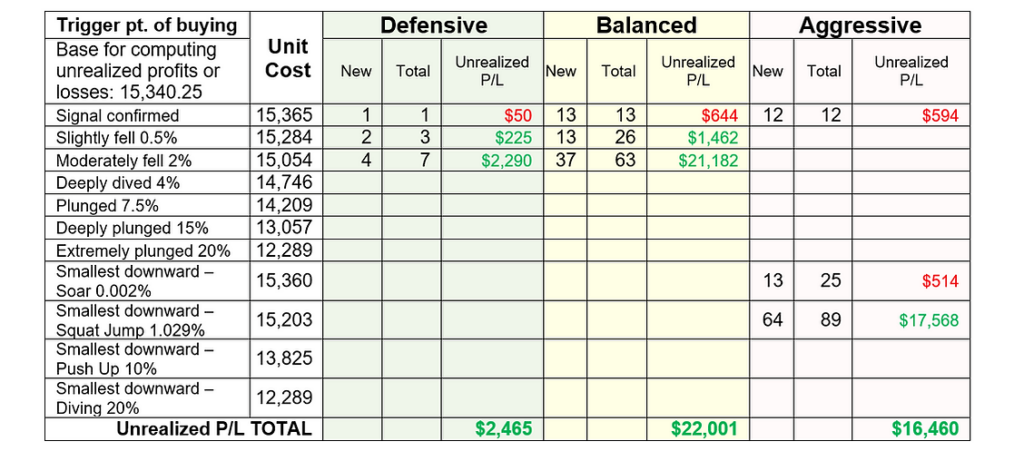
This moment is a tough test of the trader's trading experience. Is the price doing Squat-Jump, so the trader should hold the long positions? Or, is it doing Diving, so this is a chance for the trader to close long positions partially for lower the potential risk, or even close all long positions to escape with small profits?
We assume the trader judged the price would keep going up and held all long positions. Unfortunately, this first escape window quickly closed, the price turned around to do Plunge quickly. The NQ price plummeted by nearly 11% in total in the next 3 trading days, and did not start to rebound until it reached a new low 13,706 at 12:00 on January 24th. At that moment, the positions of 3 plans were as follows.
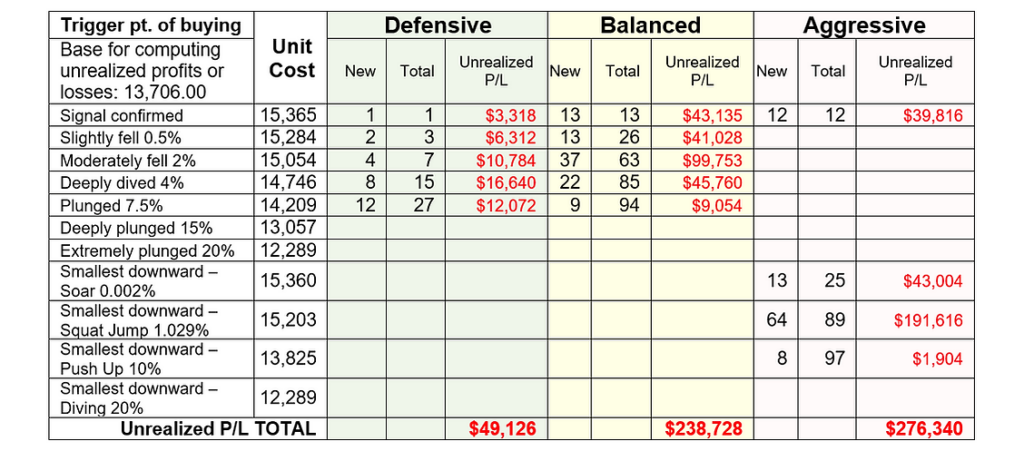
At this point, the market is in panic selling mode. Emotional traders cut loss hastily. Gambling traders received margin calls from their brokers and had to close long positions. If a trader does not consider this extreme situation when making a trading plan before starting a trade, it is very likely that the trader will follow the panic selling and realize the loss. Unrealized losses on long MNQ positions, established by the Balanced plan or the Aggressive plan, exceed the planned upper limit of trading funds $200k. If the remaining cash balance in the trading account is insufficient to meet the broker's margin requirements, and the trader fails to inject sufficient cash into the trading account by the deadline, the broker will close open positions on behalf of the trader for the necessary liquidation. The trader lost. That's why we planned to cap this trade at $200k, which is 40% of all available cash of $500k. And we should NEVER use the margin loan offered by the broker. A professional trader needs to always be prepared for extreme situations. Trading is the art of balancing opportunity and risk based on big-data and statistics, not gambling.
If a trader was fully prepared for extreme situations when formulating a trading plan, the trader could survive this darkest moment and eventually turn the trade into a profit. 7 trading days later, the second chance to escape came. The trader can close positions to cash out profits. At 7:00 of February 2nd, 2022, the NQ price rebounded to 15,260. At that moment, the positions established by 3 plans are as follows.
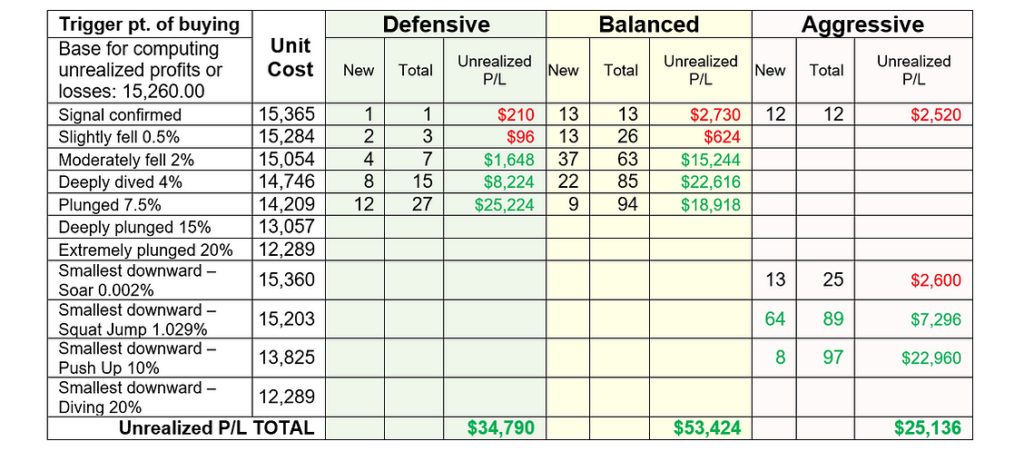
Through studying the above thrilling trading case, we have a deep understanding of how to establish a professional trading system, with the strong support of G-Signal products, to generate continuous profits through securities trading.
The above case is an extreme with a very low probability of 1.16%. We found that in the 23-year history of NQ, the overall performance of NQ Bull #5 is brilliant. It has accurately caught the bottom of most small and medium bear markets of NASDAQ. Its signaling frequency is much higher than that of NQ Bull #1 and NQ Bull #2.
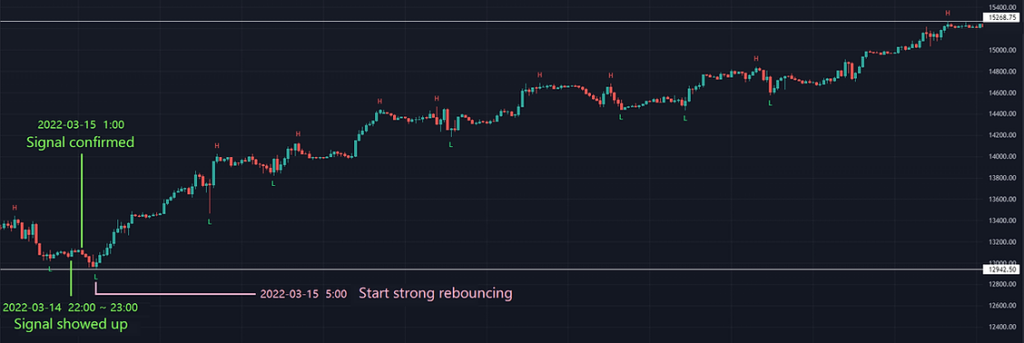
Next, let's study the case of the first bear market rally in 2022, that NQ Bull #5 accurately captured on March 15th. Please see the candlestick chart below:
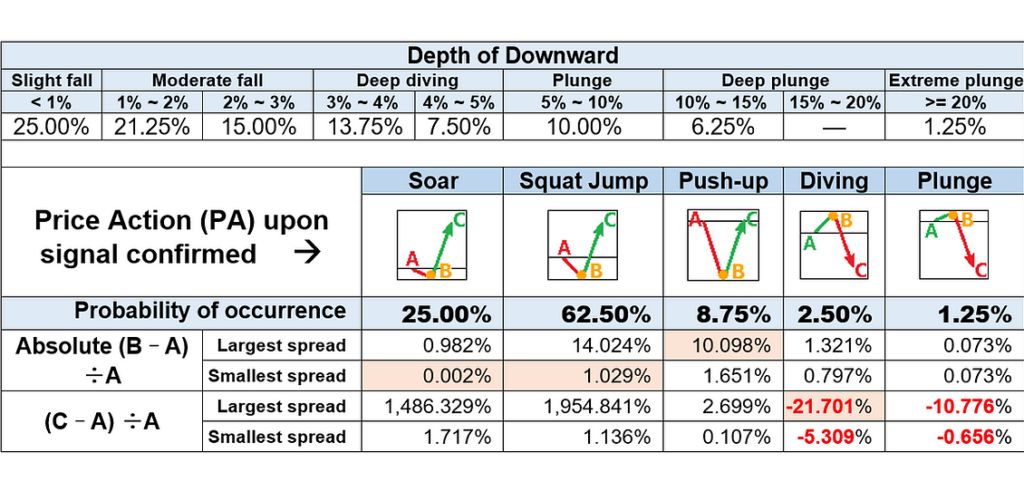
As of March 13th, 2022, the G-Signal Historical Risk & Reward Statistics of NQ Bull #5 are as follows.
The 3 trading plans corresponding to the 3 trading strategies are as follows.
From 22:00 to 23:00 on the evening of March 14th, 2022, NQ Bull #5 showed up again. It was confirmed at 13,083.25 in the early morning of March 15th. Our trading plan was triggered. The cost price of our first long MNQ position was 13,085.00. At 5:00 of March 15th, the price slightly fell to day low 12,942.50. At that moment, the positions of 3 plans were as follows.
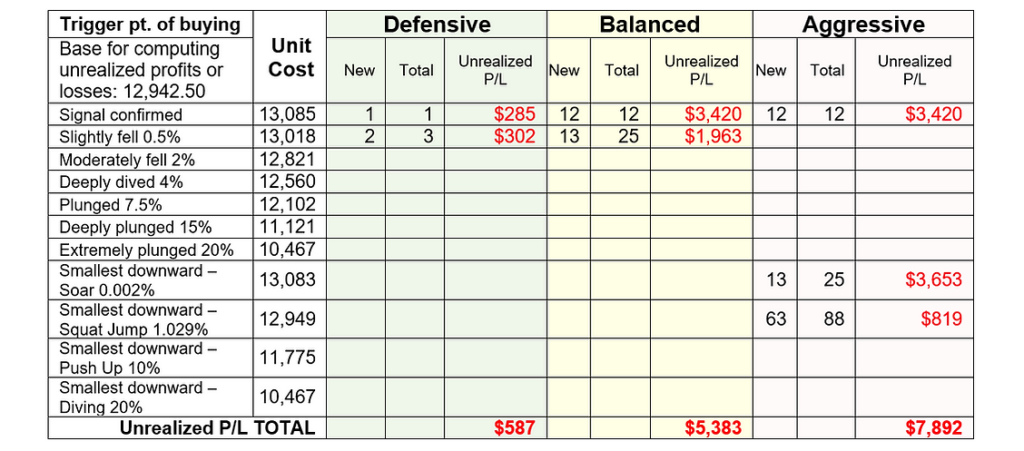
After a short squat, the NQ price started a strong bear market rebound that continued to rise for half a month. From 15:00 to 16:00 of March 29th, the NQ price touched the highest point of this bear market rally at 15,268.75. At that moment, the positions of 3 plans are as follows.
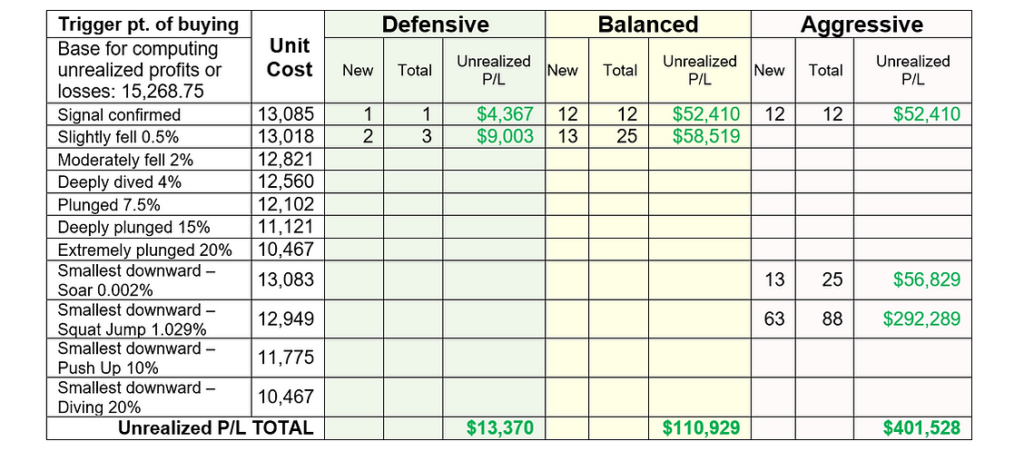
This trade, by the Aggressive plan, doubled the upper limit of planned trading funds $200k, within half one month only. This is only one of the dozens of victories that NQ Bull #5 has won in its over 23-year history, and the Best Unrealized P/L Ratio is only 52 folds. Its highest performance is 6,284 folds, achieved on March 9th, 2009. Regardless of your risk preference, you won't lose money in any trade even you unluckily encountered those 3 failures of NQ Bull #5 in the last 23 years, if you use this G-Signal product correctly.
In G-Signal Historical Risk & Reward Statistics of a signal, in addition to many price data, there are also many time data, which can help you time the market more accurately and manage positions at the correct rhythm.
Shall you have any questions about using our products, please feel free to contact us. Thank you for choosing G-Signal. We wish you successful trades, earlier financial freedom, and a better life!
Note: All data presented in this guide were collected on or before December 18th, 2022.
